Analyzing Top MLB Prospects Performance In The Big Leagues
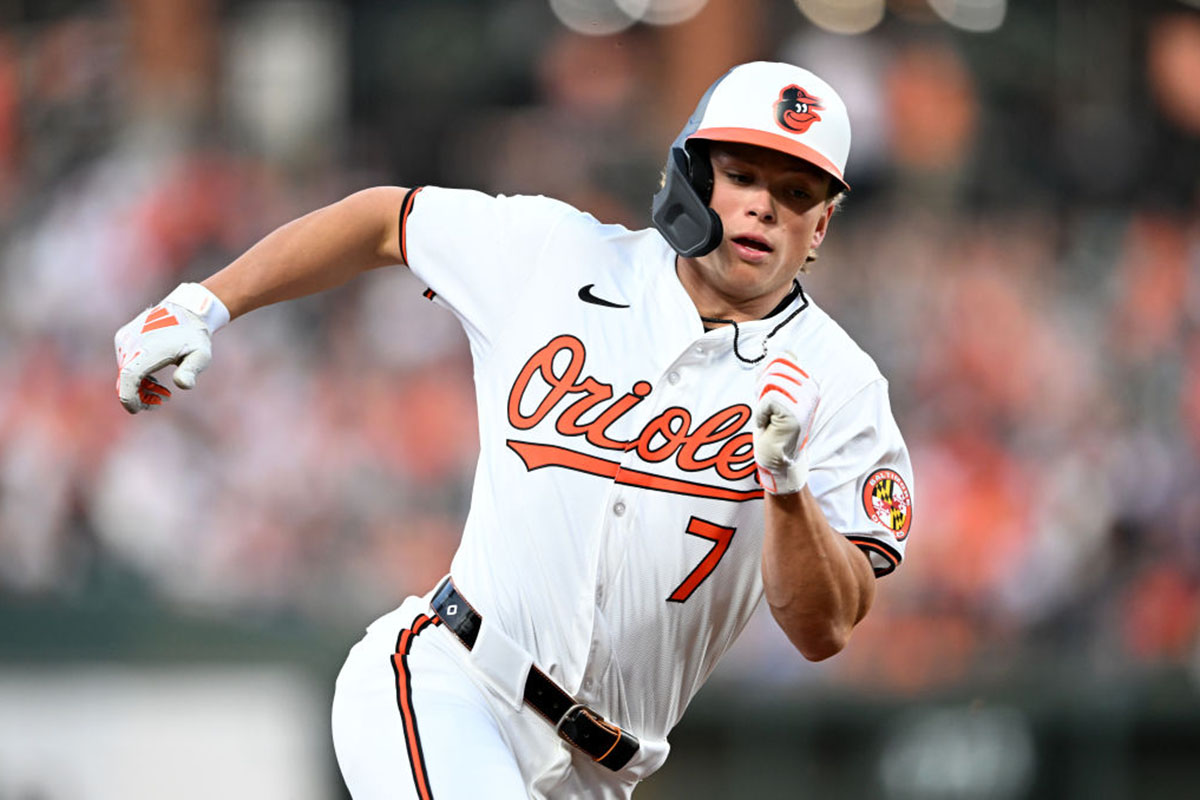
2023 #1 overall pick Paul Skenes is set to make his debut this Saturday after being called up by the Pittsburgh Pirates this week. One of the most highly anticipated pitching prospects in years, many expect the LSU product to immediately continue to dominate in the big leagues after embarrassing hitters in Triple A so far this year. But the recent MLB stint of another top prospect may give some pause to that notion. The top prospect in all of baseball according to MLB.com, Jackson Holliday had only a cup of coffee with the Orioles after getting his call up last month. Despite raking in Triple A to the tune of a staggering 1.013 OPS, the top pick from the 2022 draft spent just two weeks with Baltimore, appearing in 10 games and going just 2-for-34 at the plate before being sent back to the Norfolk Tides.
That got us curious about what recent history’s top prospects can tell us about what fans can expect from Skenes and Holliday as they embark on their MLB careers. We examined the rookie years and full careers of baseball’s top prospects from 2011 on to see how they have fared in the bigs. If you’re interested in placing a wager on any big league games, including Skenes debut, check out our bet365 bonus code for special offers.
How Do Top Prospects Perform in the MLB?
Paul Skenes is the man of the hour, so we begin by taking a look at the top pitching prospects in recent history. Talent evaluators seem to be less confident projecting pitchers than hitters, as only 11 pitchers have been ranked as a top five prospect in baseball since 2011. The last time a pitching prospect was listed as the top prospect in the sport was when Shohei Ohtani entered the league in 2018. That being said, 11 pitchers is still enough to take a look at how they fared in the bigs. Check out their average numbers from their rookie years and full career averages so far below.
| W | L | W-L% | ERA | ERA+ | WHIP | WAR | |
| Rookie Year | 8 | 6 | 0.564 | 3.48 | 119.64 | 1.286 | 1.8 |
| Career | 54.00 | 50.45 | 0.523 | 4.01 | 106.27 | 1.272 | 10.8 |
The numbers paint a pretty bright picture for the Pirates newest addition. Top pitching prospects tend to perform pretty well when they reach the bigs, averaging more wins than losses and a sub-3.5 ERA. A 1.286 WHIP is also a pretty impressive number for young stars facing the highest level of competition for the first time. For comparison's sake, so far this season the average ERA across the league is 3.98 and the average WHIP is 1.273, numbers that top prospects have hovered right around or even beaten. Pitcher’s this season have also averaged 8.6 strikeouts/9 innings and 2.59 strikeouts/walk. Top prospect’s marks for those two stats in their rookie years averaged out to 8.55 strikeouts/9 and 2.49 strikeouts/walk. Based on this Pittsburgh fans can expect their new starter to perform as well or better than the average MLB pitcher this season.
Across their careers though, top pitching prospects end up being pretty much just like everyone else; average. While their WHIP will generally continue to improve, win/loss percentage, ERA, and ERA+ all decrease to right around the league average marks across their careers. Skenes and the Pirates are hopeful that his stuff and desire to continue improving will help him buck the trend and remain above average.
Now we turn our attention to hitters. Jackson Holliday struggled in his first of the majors but history suggests that when he gets there full time he will do just fine. Take a look at the average stats for the 27 hitters who have ranked as a top three prospect since 2011 below.
| BA | OBP | SLG | OPS | OPS+ | H | R | HR | RBI | WAR | |
| Rookie Year | 0.260 | 0.329 | 0.453 | 0.783 | 113.59 | 109.15 | 63.63 | 17.96 | 56.30 | 2.7 |
| Career | 0.267 | 0.340 | 0.465 | 0.805 | 119.93 | 658.74 | 389.00 | 111.67 | 352.52 | 18.9 |
On the whole, top position player prospects perform well when they reach the bigs full time and only continue to get better. For comparison, the average slashline in the majors so far this season is .240/.312/.386 for an OPS of .698. Top rookies average better numbers in each category. Unlike the pitchers we examined, young hitters tend to just get better and better as their careers unfold. Career averages in every category improved over rookie averages in our data set. If we take a look at their average WAR (an imperfect but very helpful metric) we see that in their rookie seasons top prospects have a 2.7 mark, indicating starter level play. When we look at their career WAR averaged over 162 games they reach a mark of 4.3, which represents above-average starter/borderline All-Star level performance on the field. You can find the career WAR averaged over 162 games for all the prospects we examined in our full data set, linked below.
If after reading this article you think you have a good idea of how Skenes highly-touted debut will go, be sure to check out our best sportsbook bonus to get the best offers.
Methodology
All MLB stats are courtesy of Baseball Reference. Minor League stats are courtesy of MiLB.com. All prospect rankings are those listed in MLB.com’s Prospect Rankings. The top three prospects from each year between 2011 (the first year MLB.com’s Prospect Rankings are currently available for) and 2023 were examined as part of our data set, as well as all pitchers ranked in the top five of their year. For the purposes of our data, the season in which a player exceeded their rookie limits was considered their rookie year. Our full data set, including a full rundown of each player's statistics beyond what is listed in this article, can be accessed here.
Mlb News
-
 MLB MAY 20, 2024
MLB Daily Free Picks, Predictions, Odds
- MLB MAY 20, 2024
Today’s MLB Player Prop Bets for May 20, 2024
- MLB MAY 17, 2024
World Series Odds, Betting Trends: Everything You Need To Know
- MLB MAY 10, 2024
Analyzing Top MLB Prospects Performance In The Big Leagues
- MLB MAY 20, 2024
MLB Parlay Picks for May 20, 2024
- MLB APR 29, 2024
2024 MLB Win Total Odds